Empire — the darknet marketplace analytics

Intro#
The Empire is currently (as of writing), the biggest darknet marketplace for illegal goods.
The listings are very hard to track, since every minute vendors are adding and removing products.
The listings, that was obtained by scraping, provides a general overview what is happening on the marketplace. Also, note that the data is filtered by listing who has at least 2 sales (there are many fake listings with ridiculous pricing with 0 sales which can mess up the overall data).
Let’s go through data together and see what’s happening.
Categories#
The listings are split into categories and we get an overview what are the most popular categories on Empire.
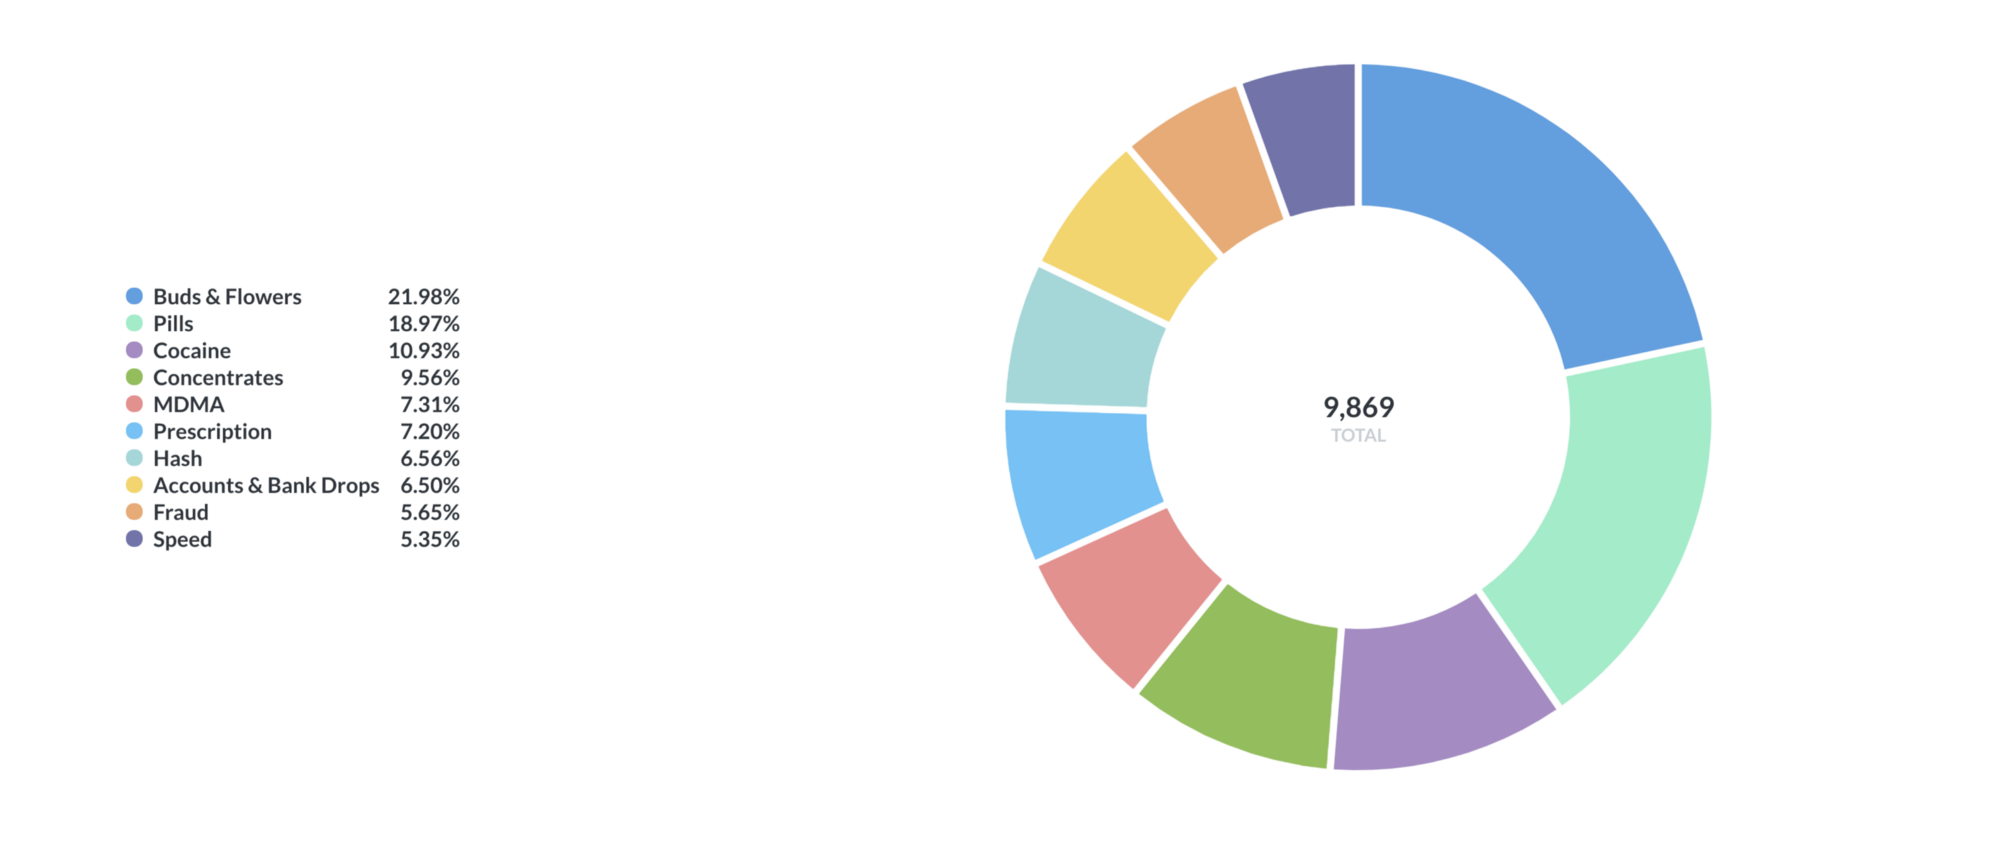
There are many categories, so I’am showing top 10. From this chart, we can see that Buds & Flowers is a top category on Empire, following by Pills.
Sales#
If we add how much was sold by each category, we would get
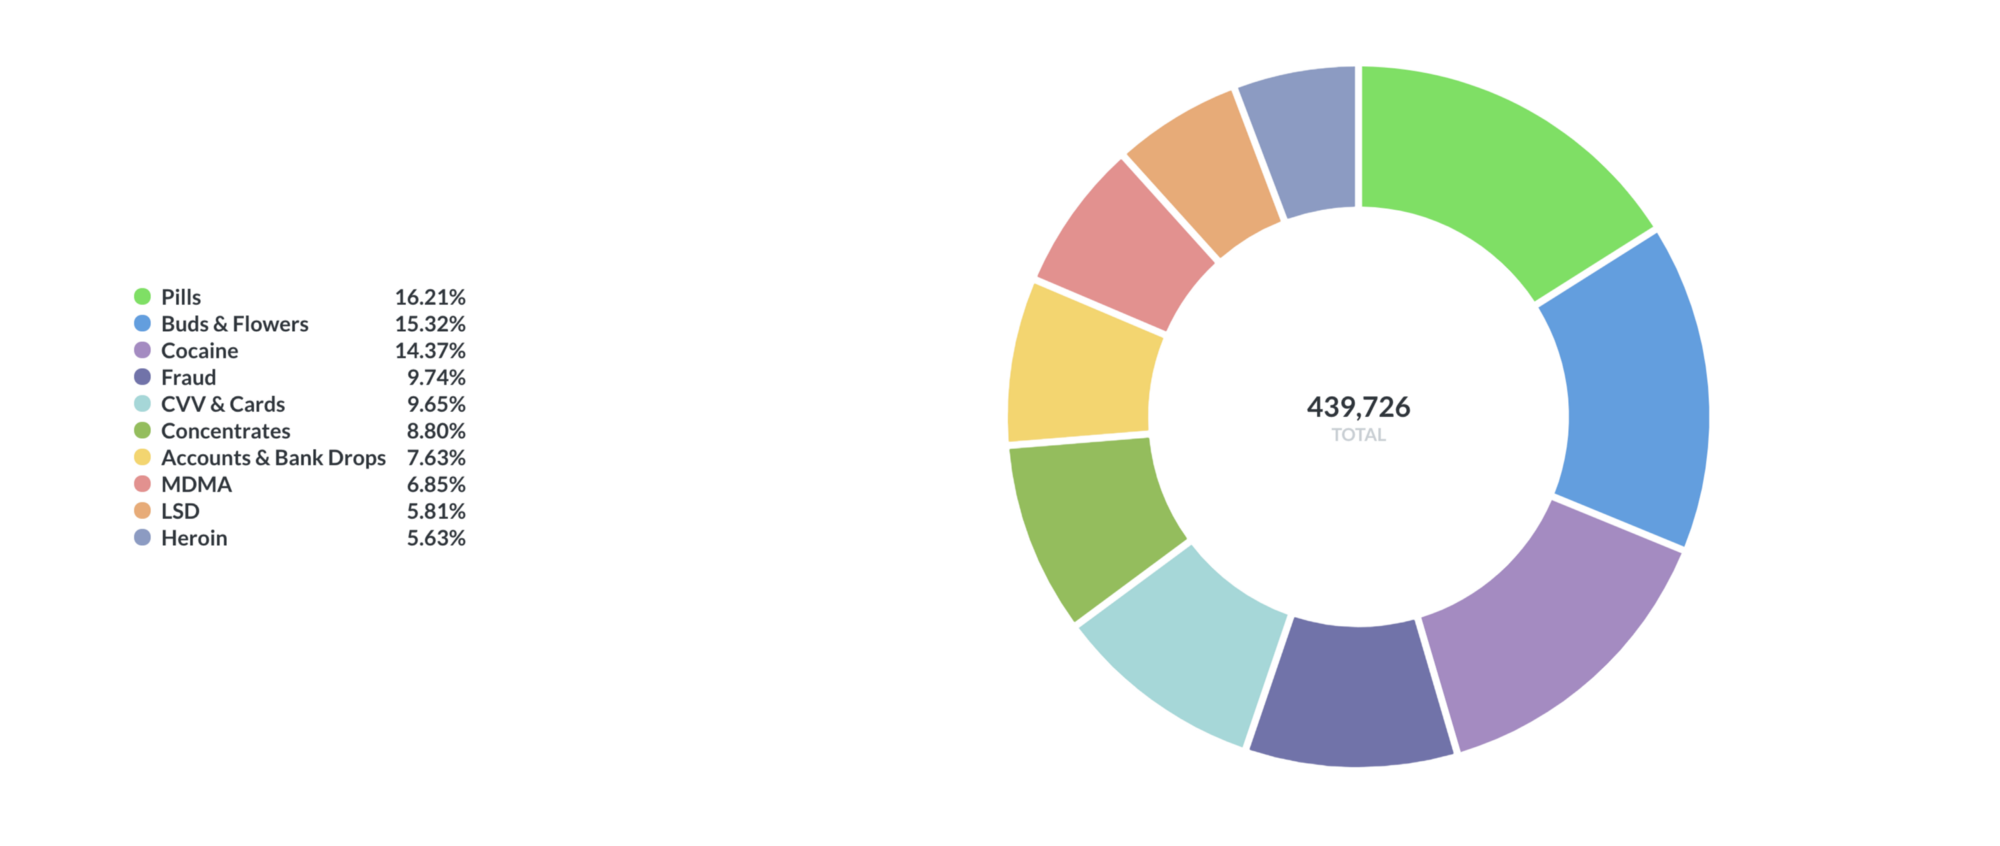
Well, this is interesting. While Empire has most of Buds & Flowers listing, the top selling category is Pills
Pricing#
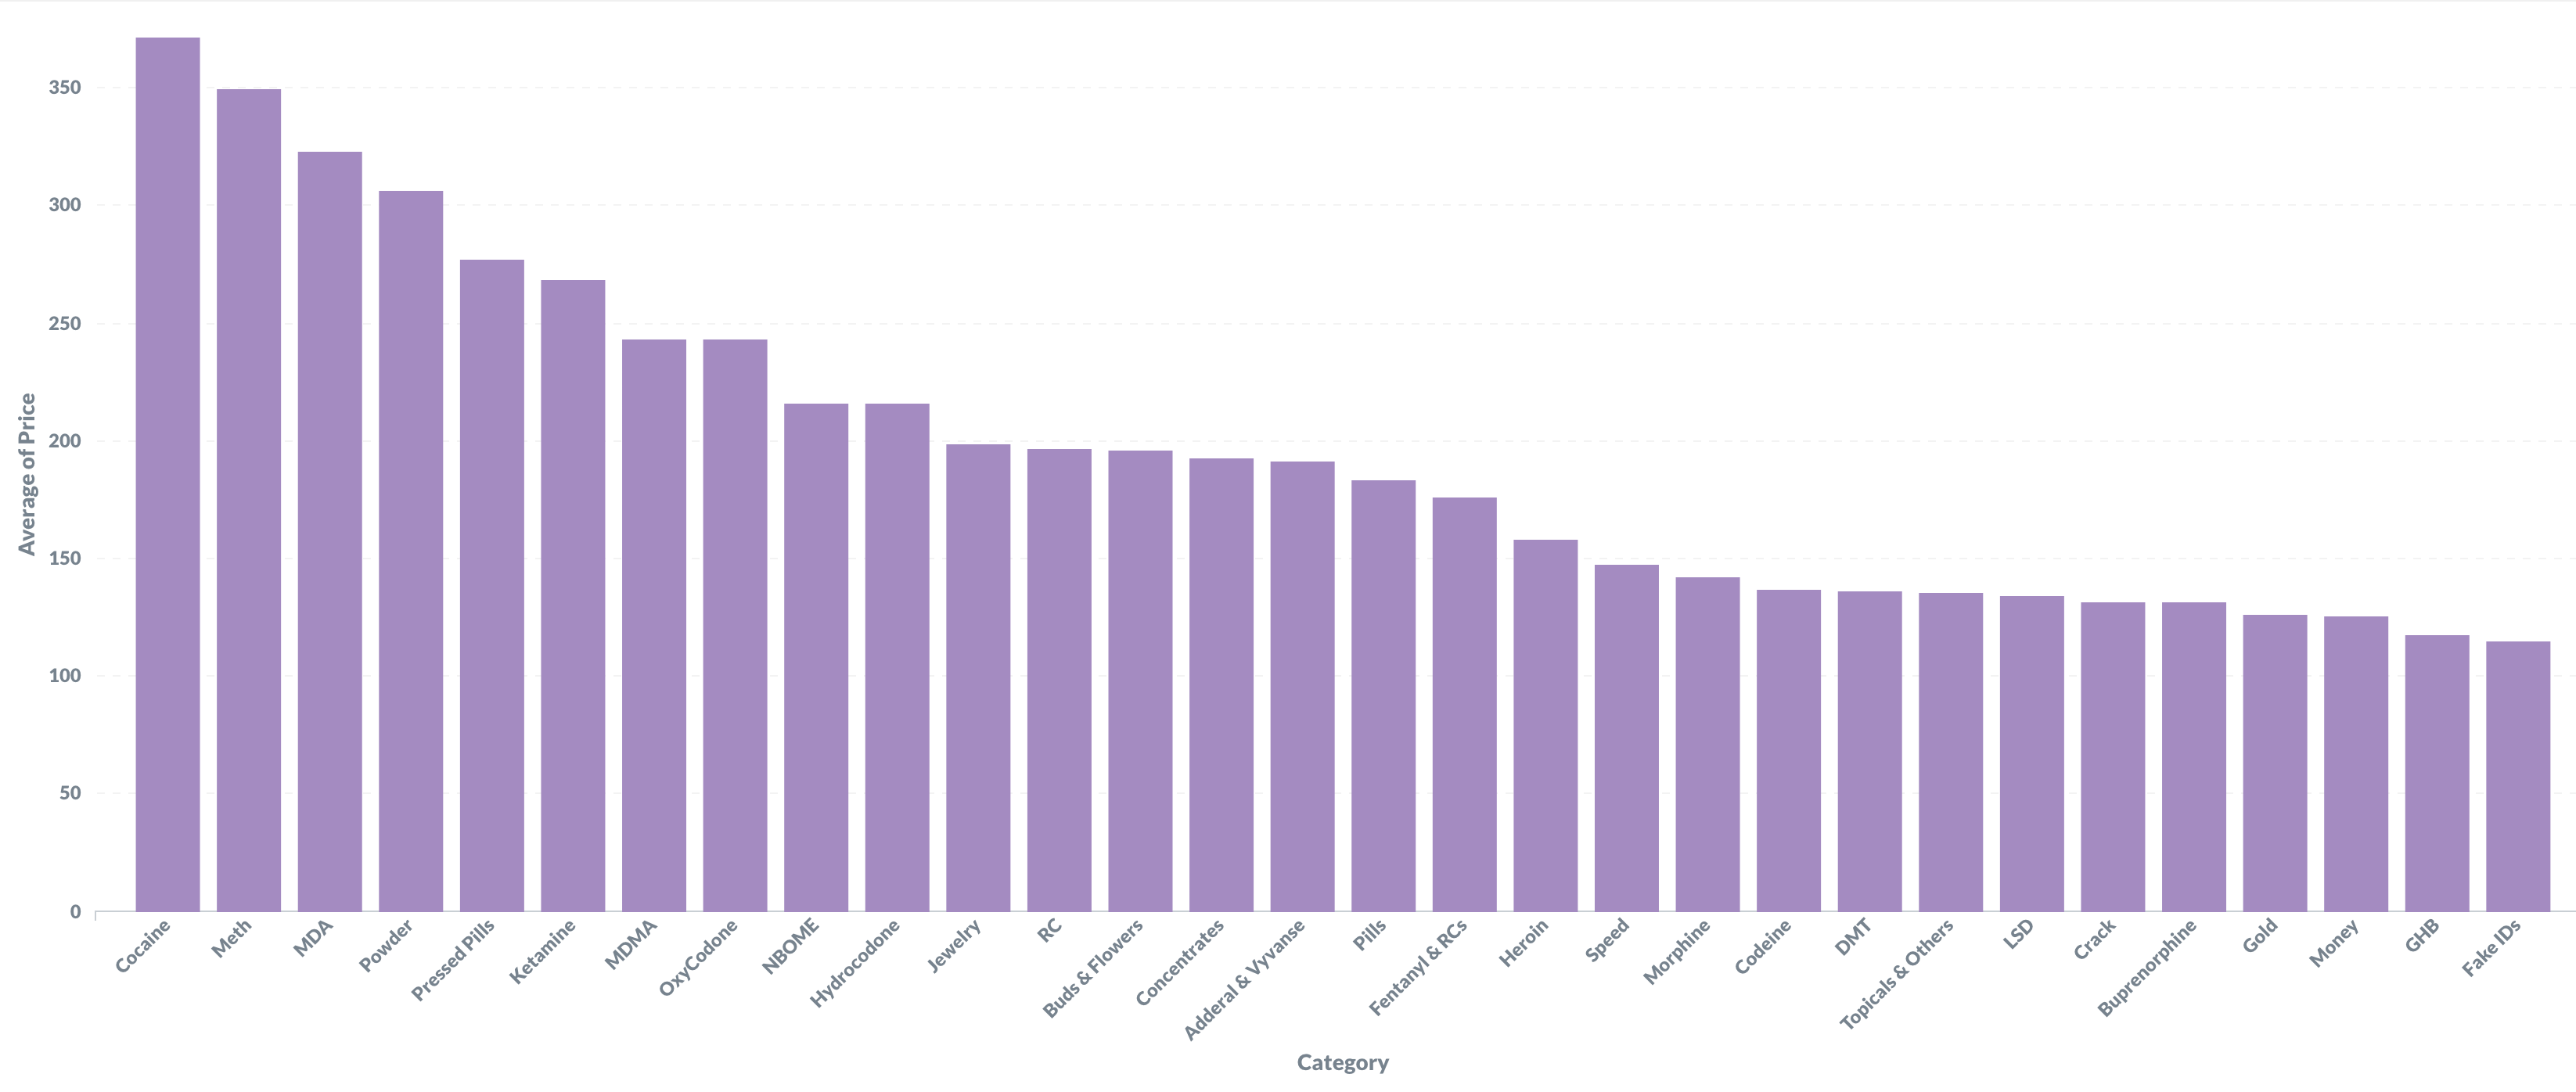
While each category has products which comes in different packages (eg 1,2,3 g or kg), let’s take an average base price in USD.
We can see that top pricing category Cocaine sells by average ~$400.
If you are looking for Fake ID, you will pay around ~$125.
Also, the top category by listing Buds & Flowers comes around ~$190, same as top category by sales — Pills
Cryptocurrencies#
Empire has a support for BTC, XMR and/or LTC. We can view how many vendors are supporting multiple cryptocurrencies.
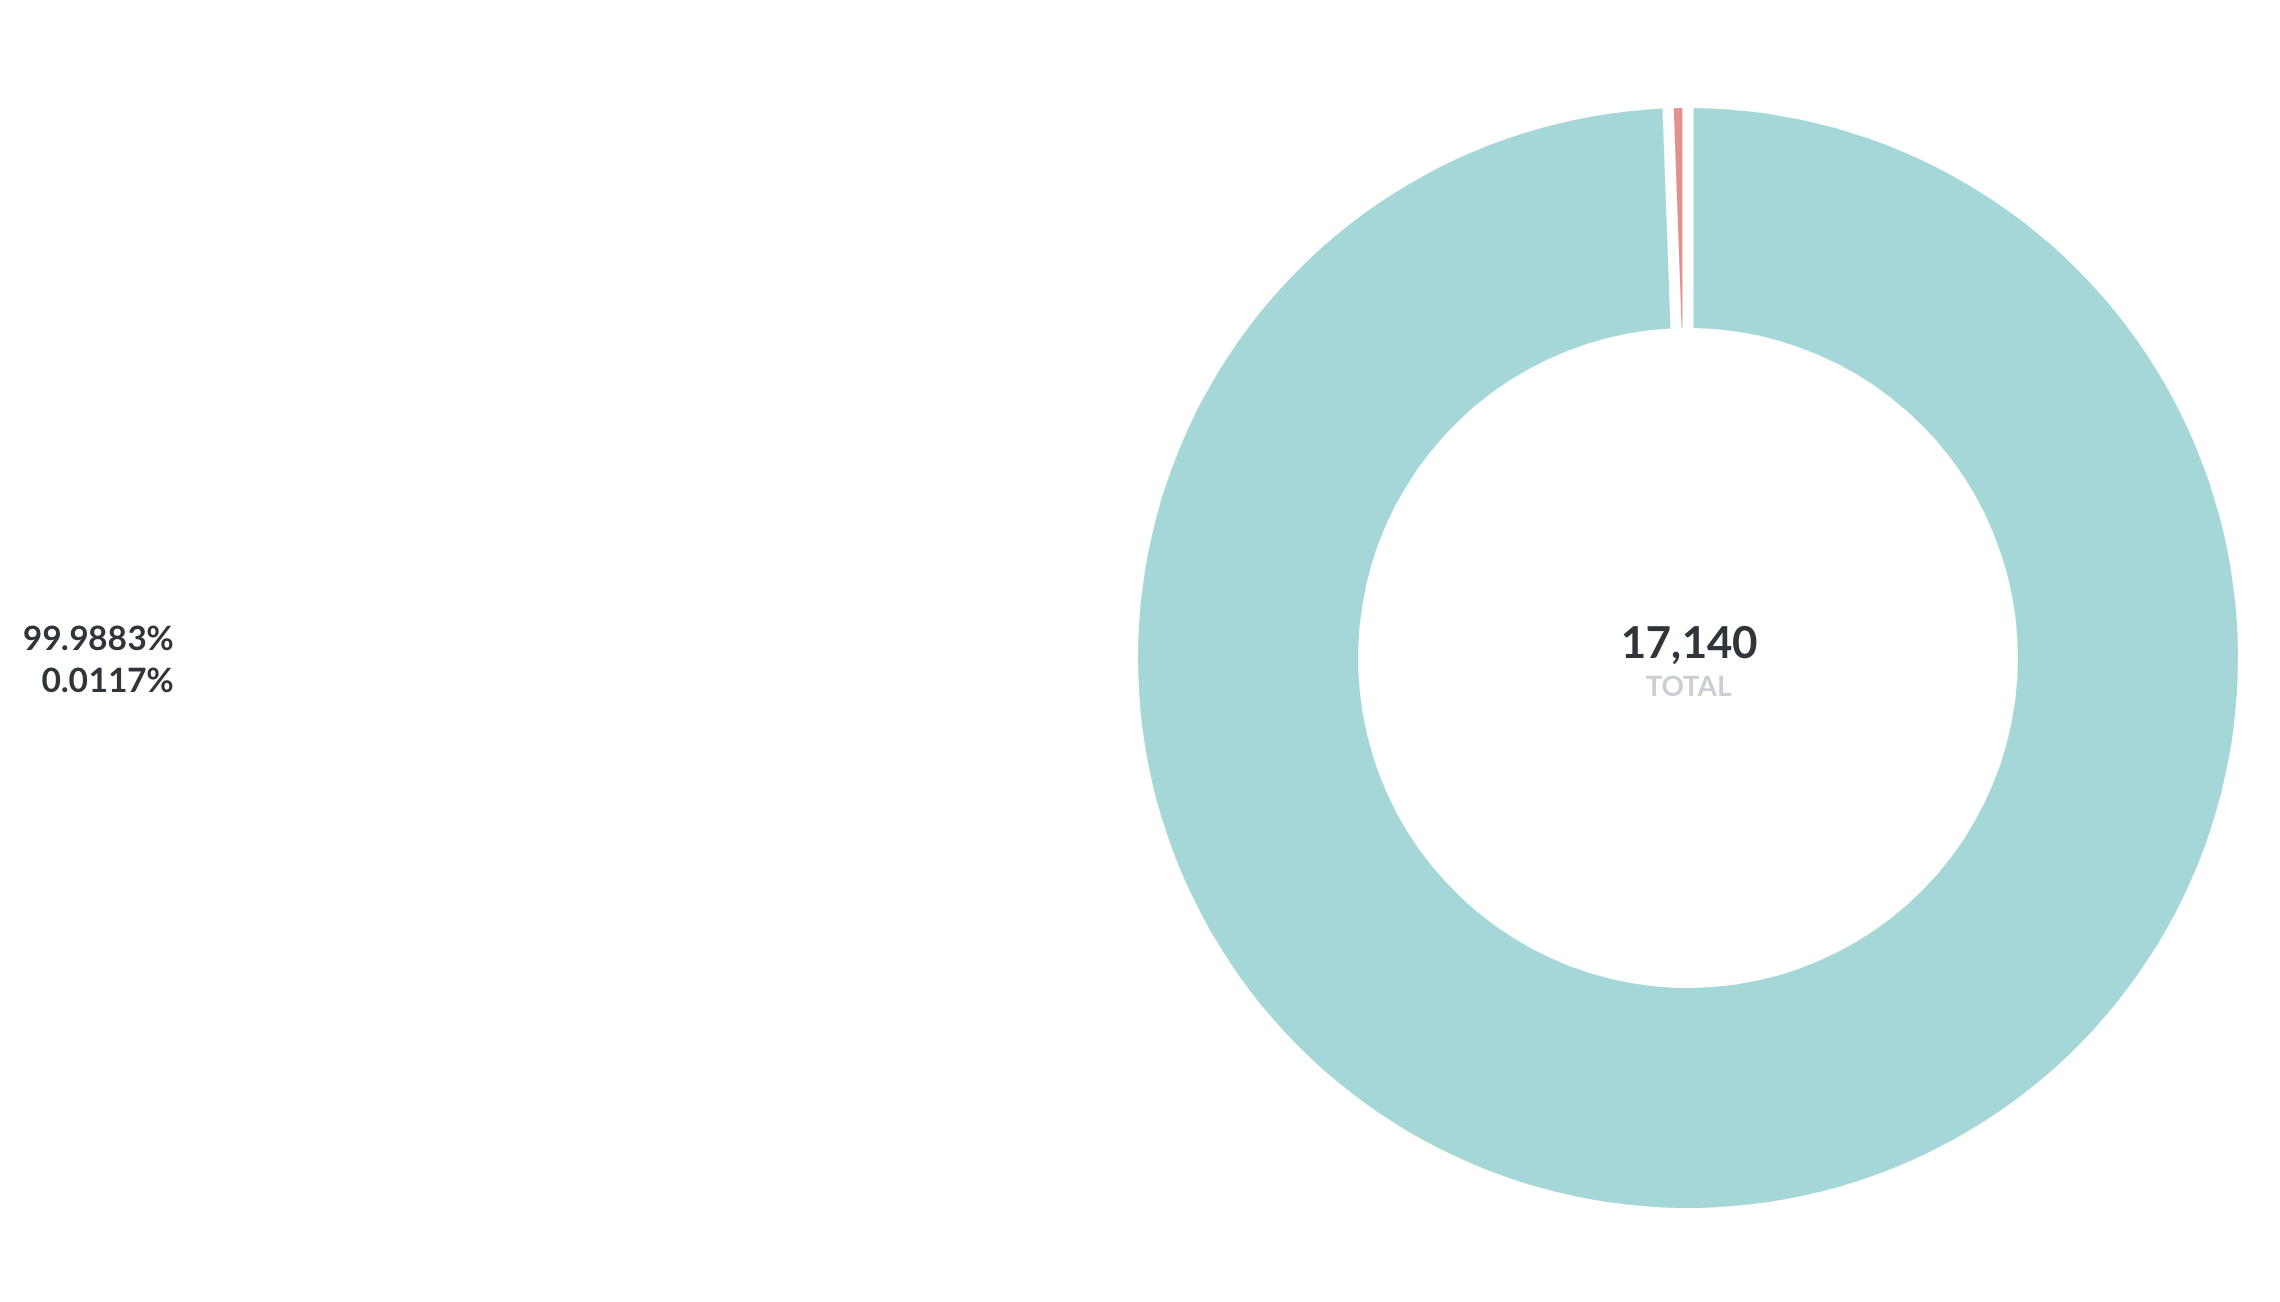
BTC holds most of the market. Almost 100% (99.9%). There are few vendors that you can count on a single hand that does not accept BTC.
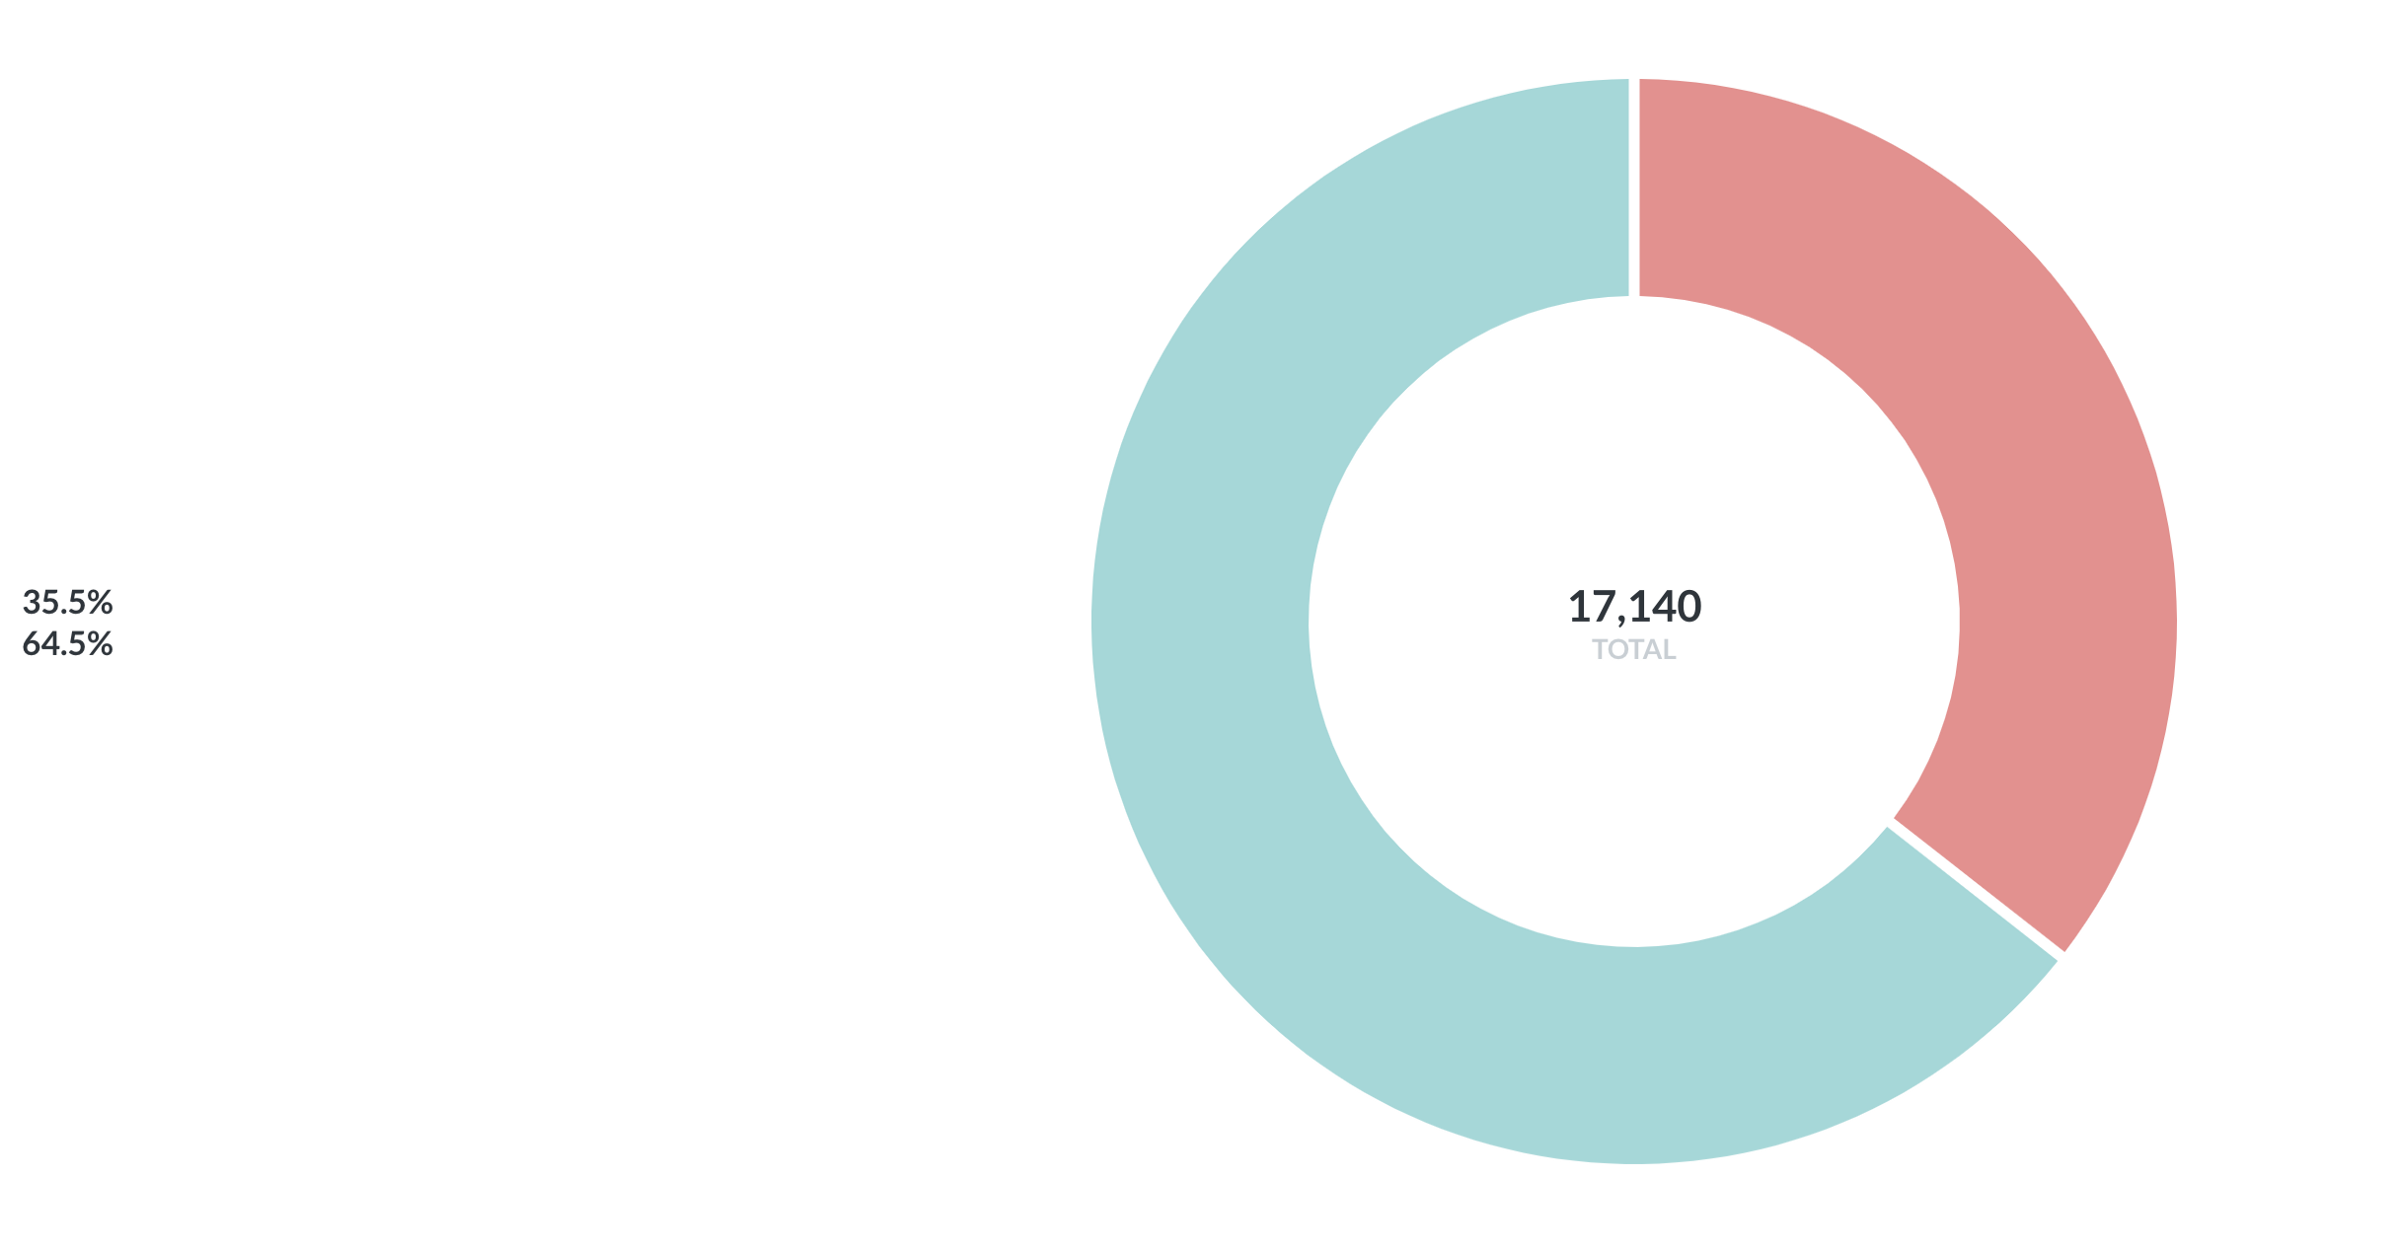
XMR is the next popular coin. ~65% of vendors are accepting it. Monero holds the title of the privacy coin, so it’s not surprising that more than half of vendors are supporting it.
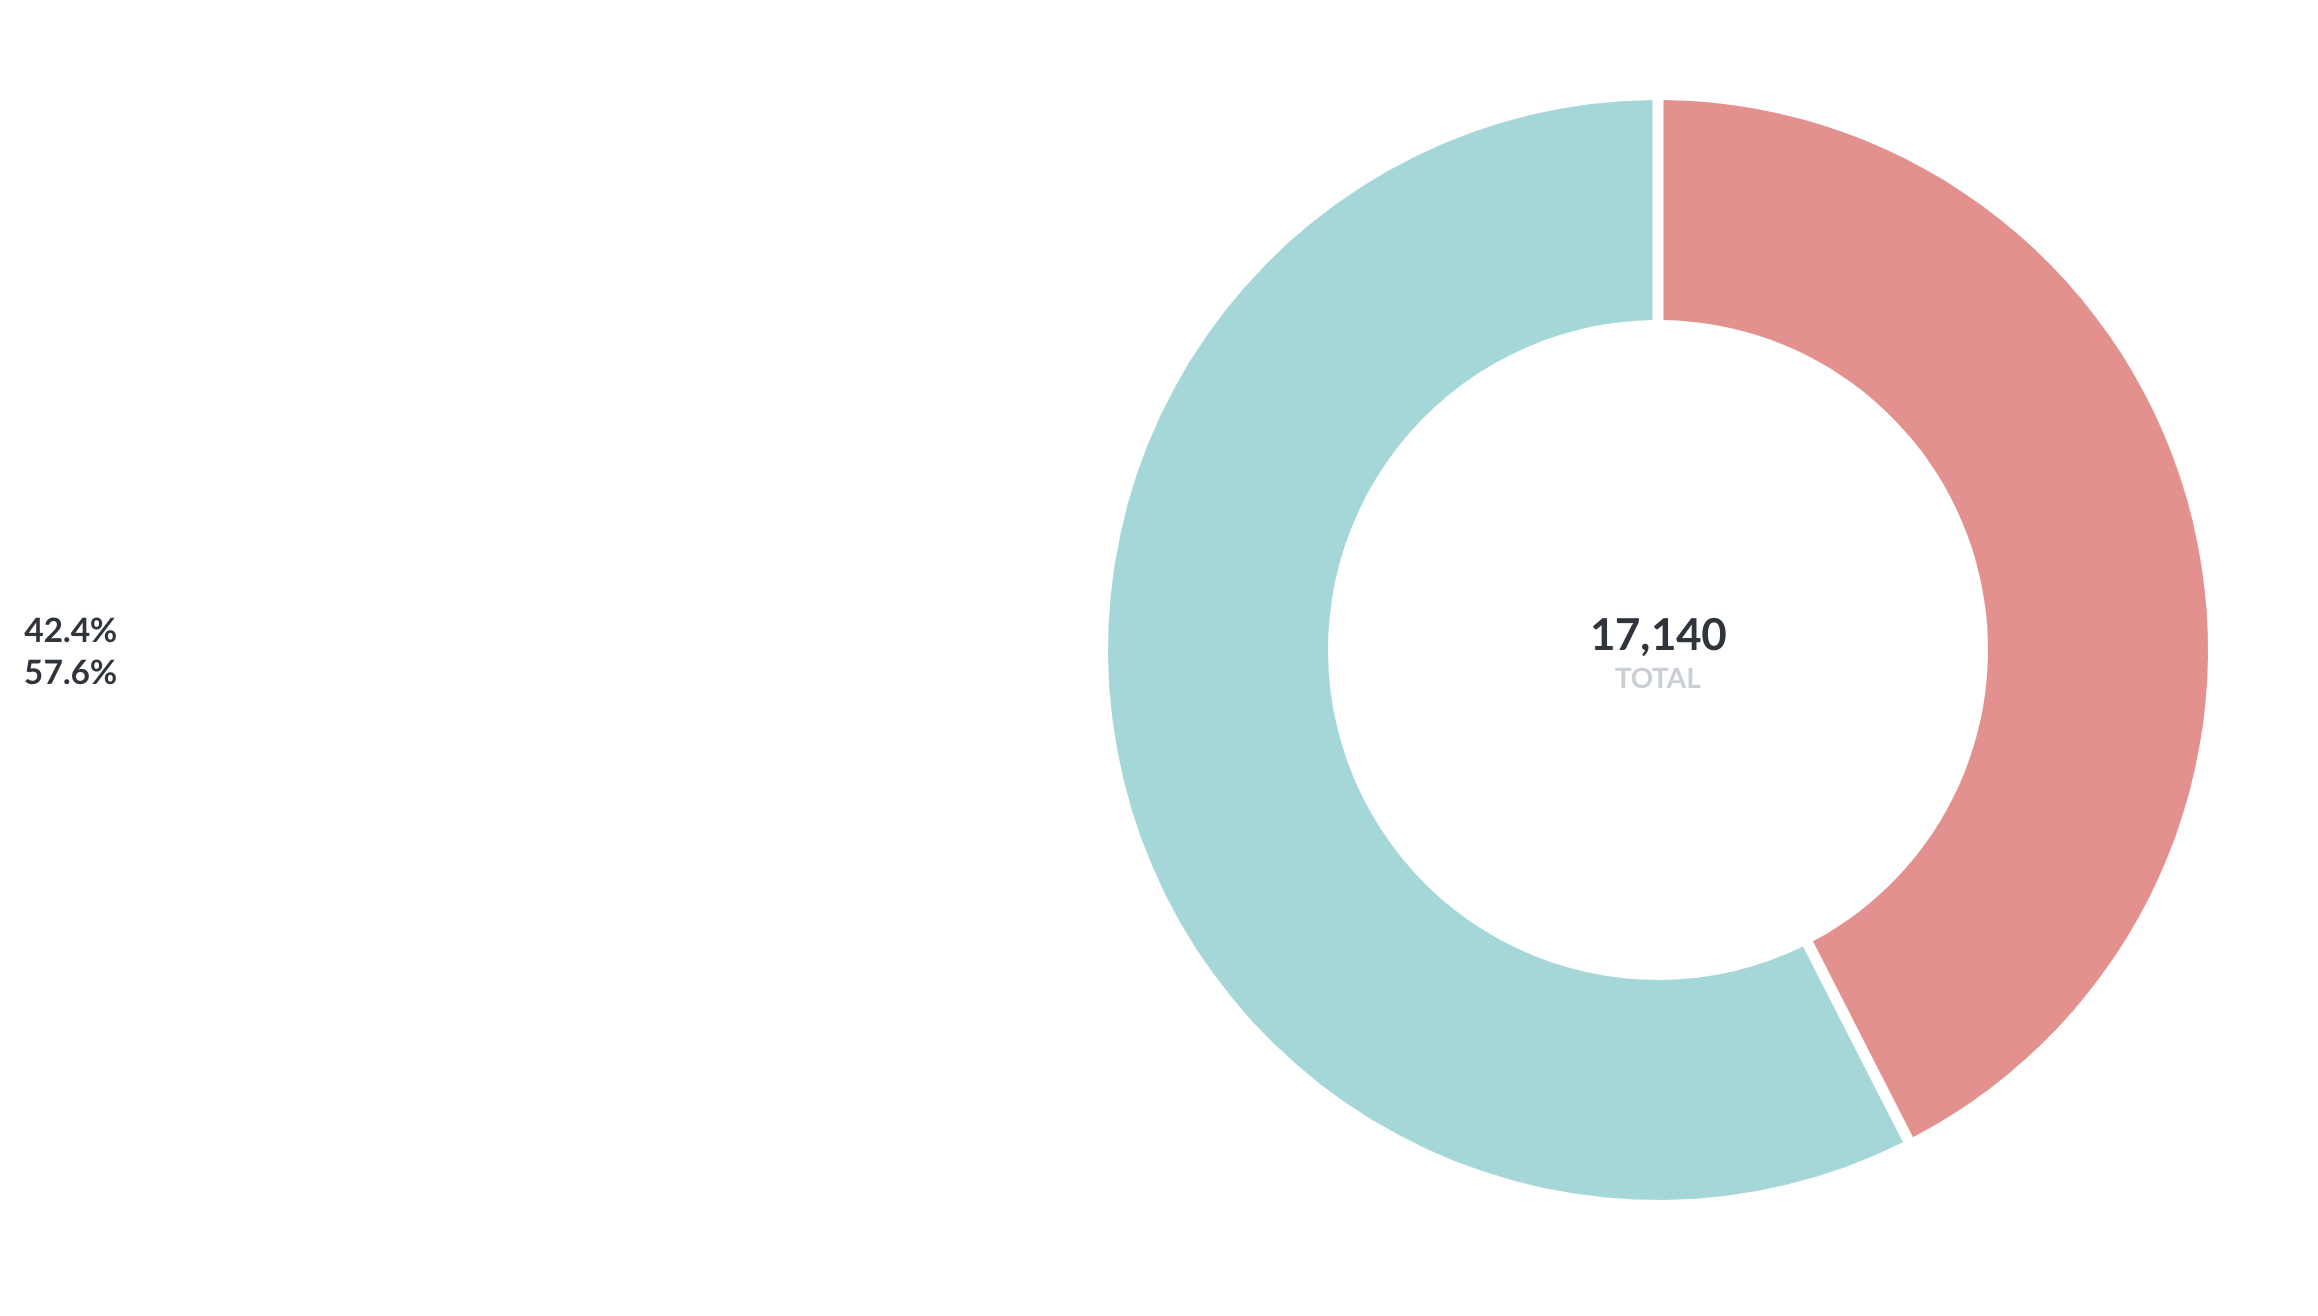
The last coin is LTC. Still, 57% is a solid amount of vendors that are supporting this type of cryptocurrency.
Vendors#
Who are top vendors? Vendors that has a high combination of views and sales. Let’s break it down. Obviously, the vendors username are removed for anonymity.
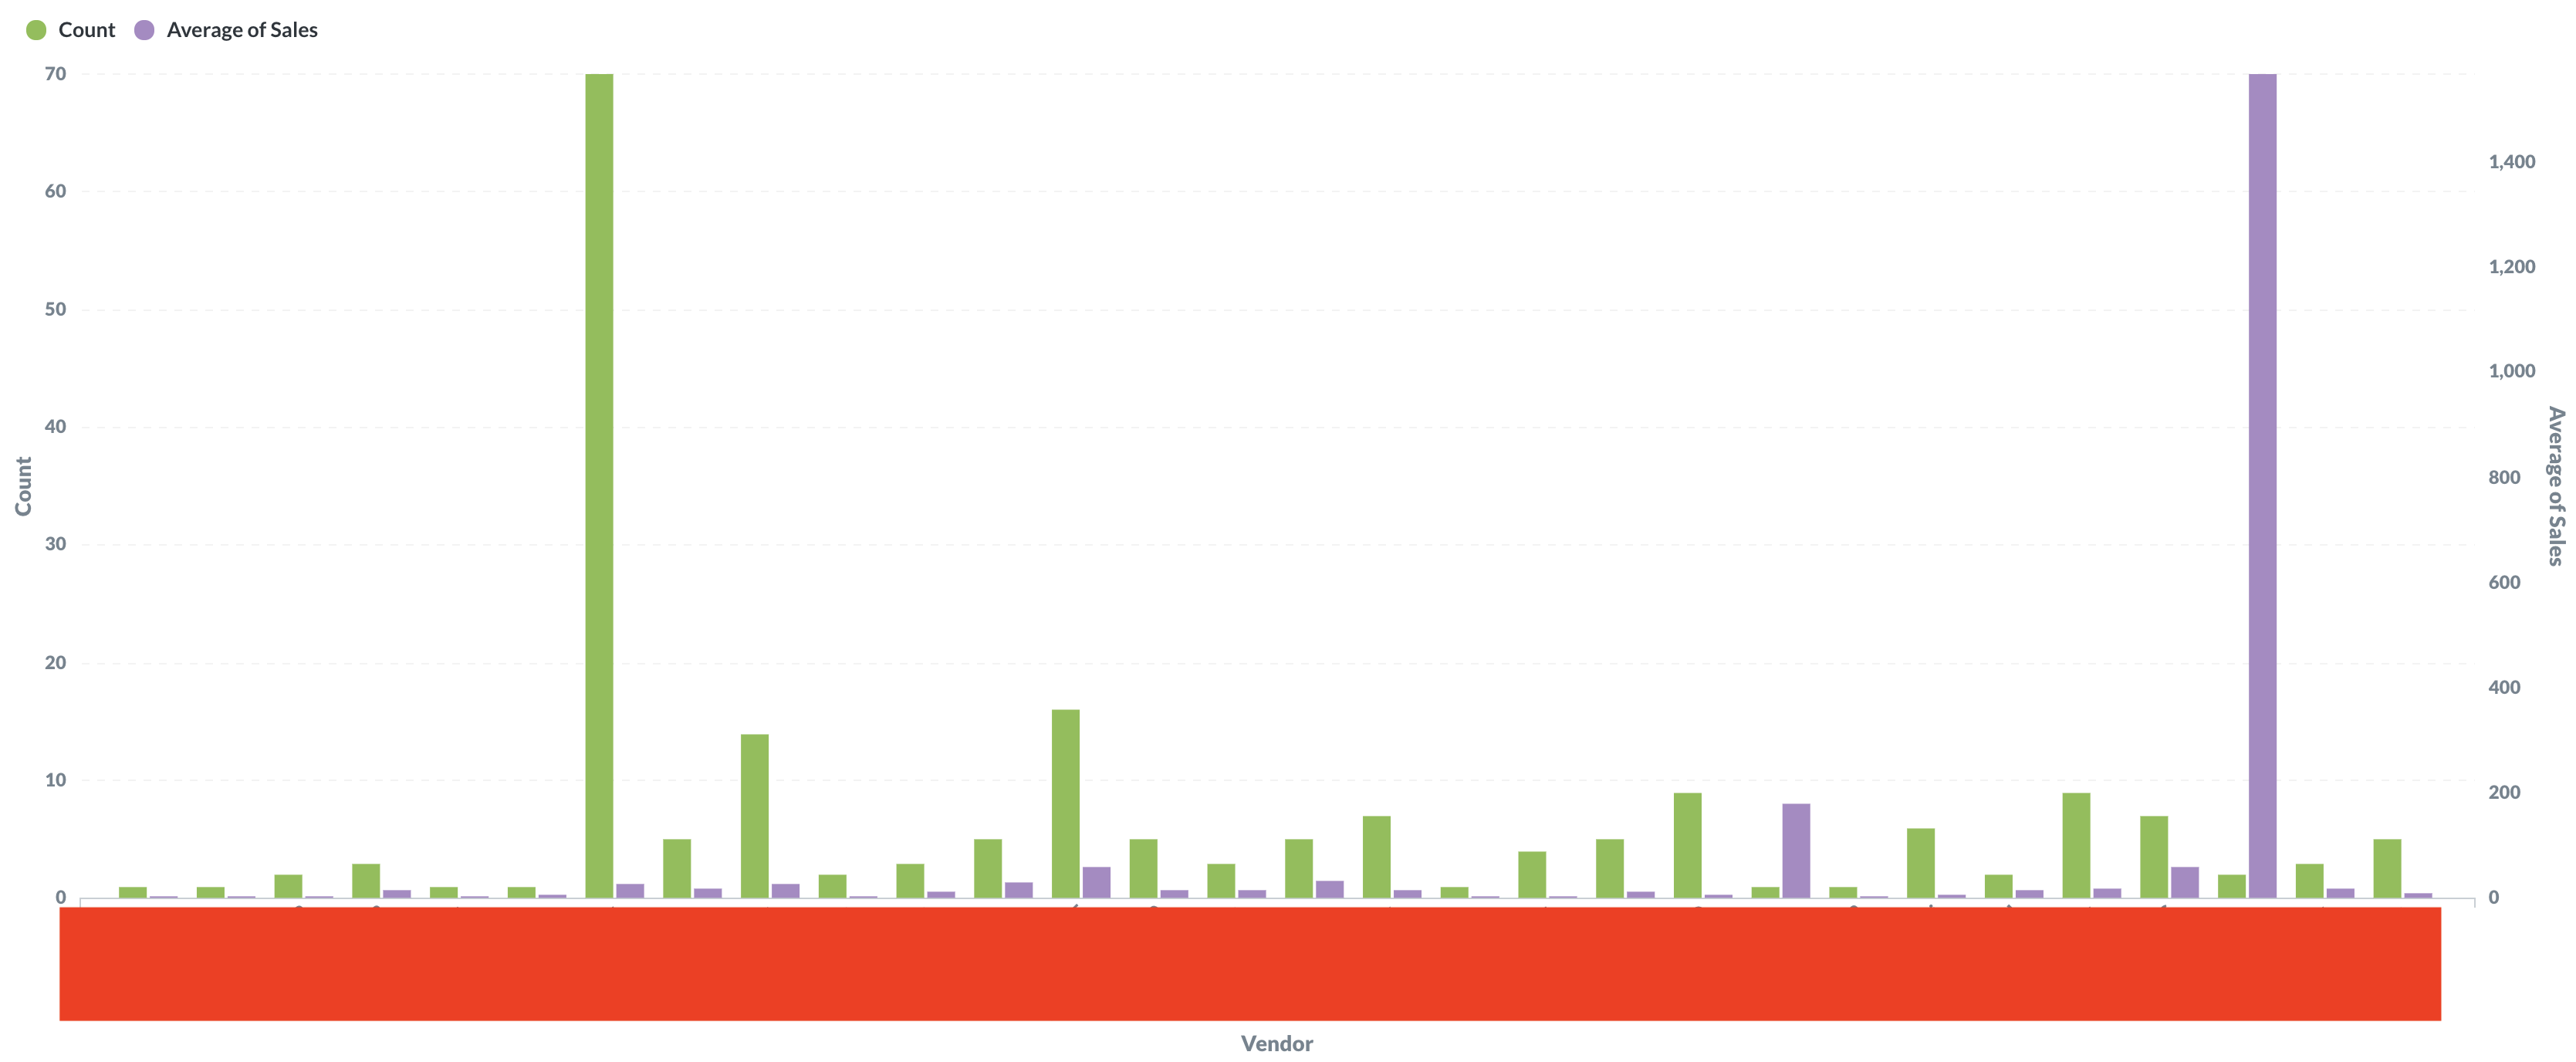
The green bar represents how many products a vendor has on the market, while purple shows average sales. Here we can see that one vendor has over 70 products on his store, but the sales are low. On the other hand, we have a vendor who has 2 products, but sales are over 1500.
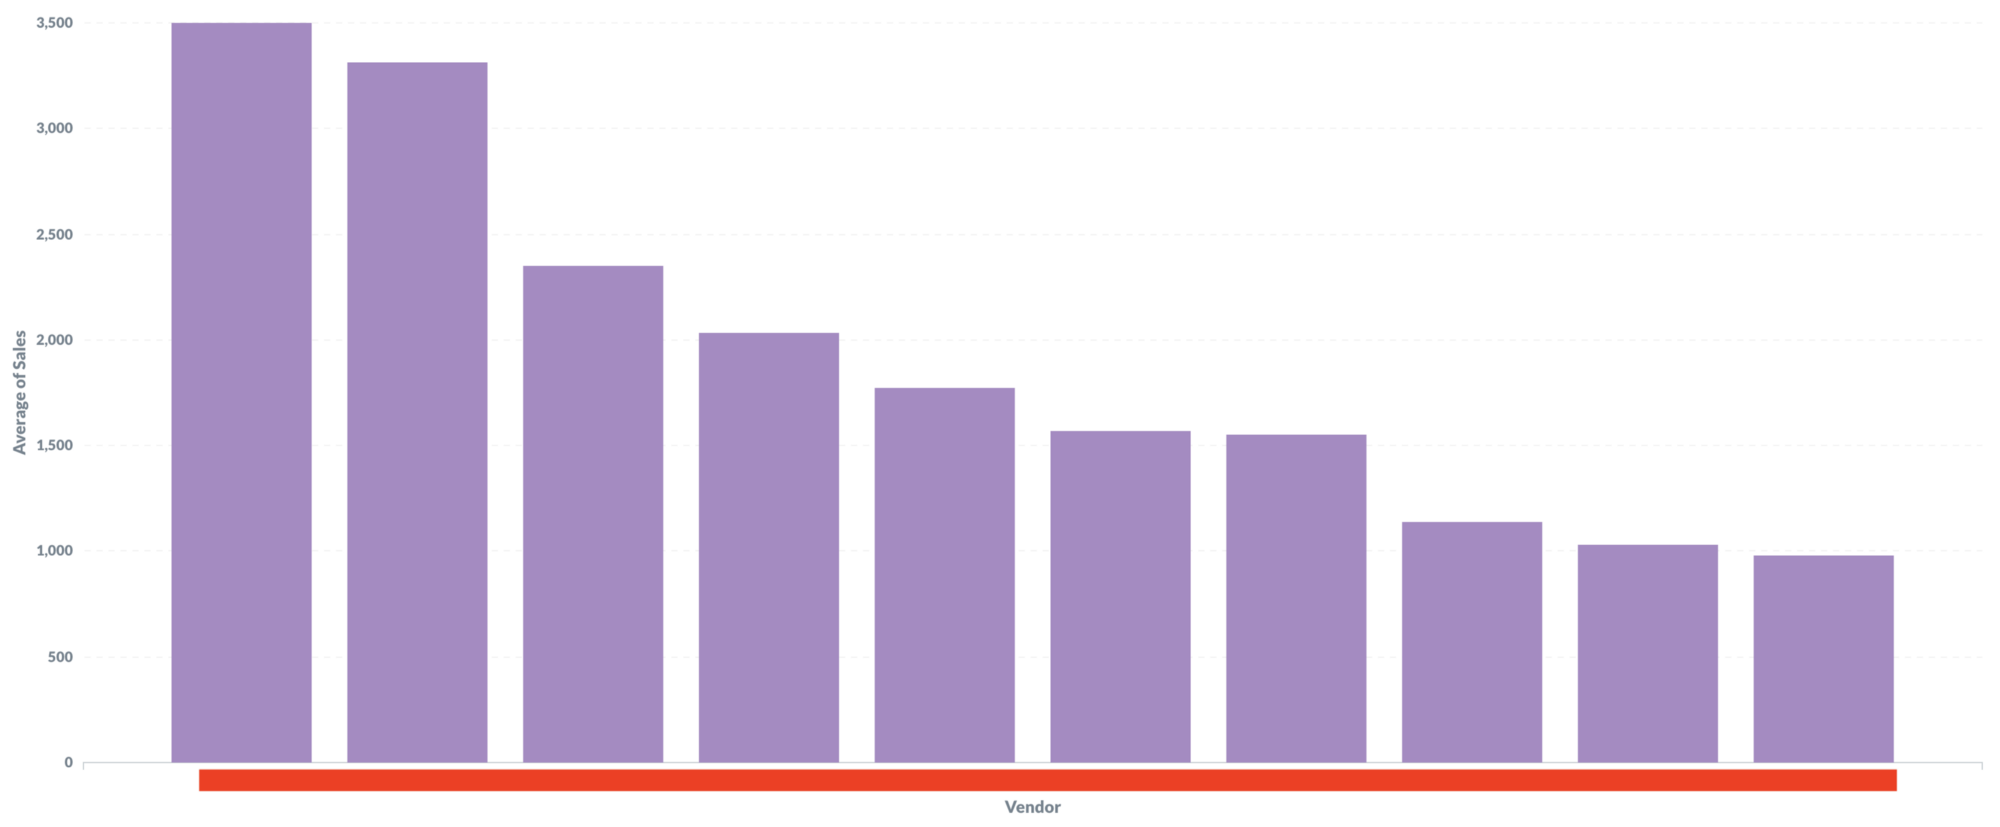
The top vendor has an average of 3500 sales. Also, a nice data point to show here is a jump point.
Once the vendor gets around ~2000 sales, he jumps almost to ~3500 sales.
If we look at the start, we can see a nice build up — 800 sales, then 900 sales, then 1200, 1500, 1800 etc.., but once at around 2000 sales something happens and he jumps with sales.
Do vendors starts with more aggressive marketing? Or something else? I don’t know.
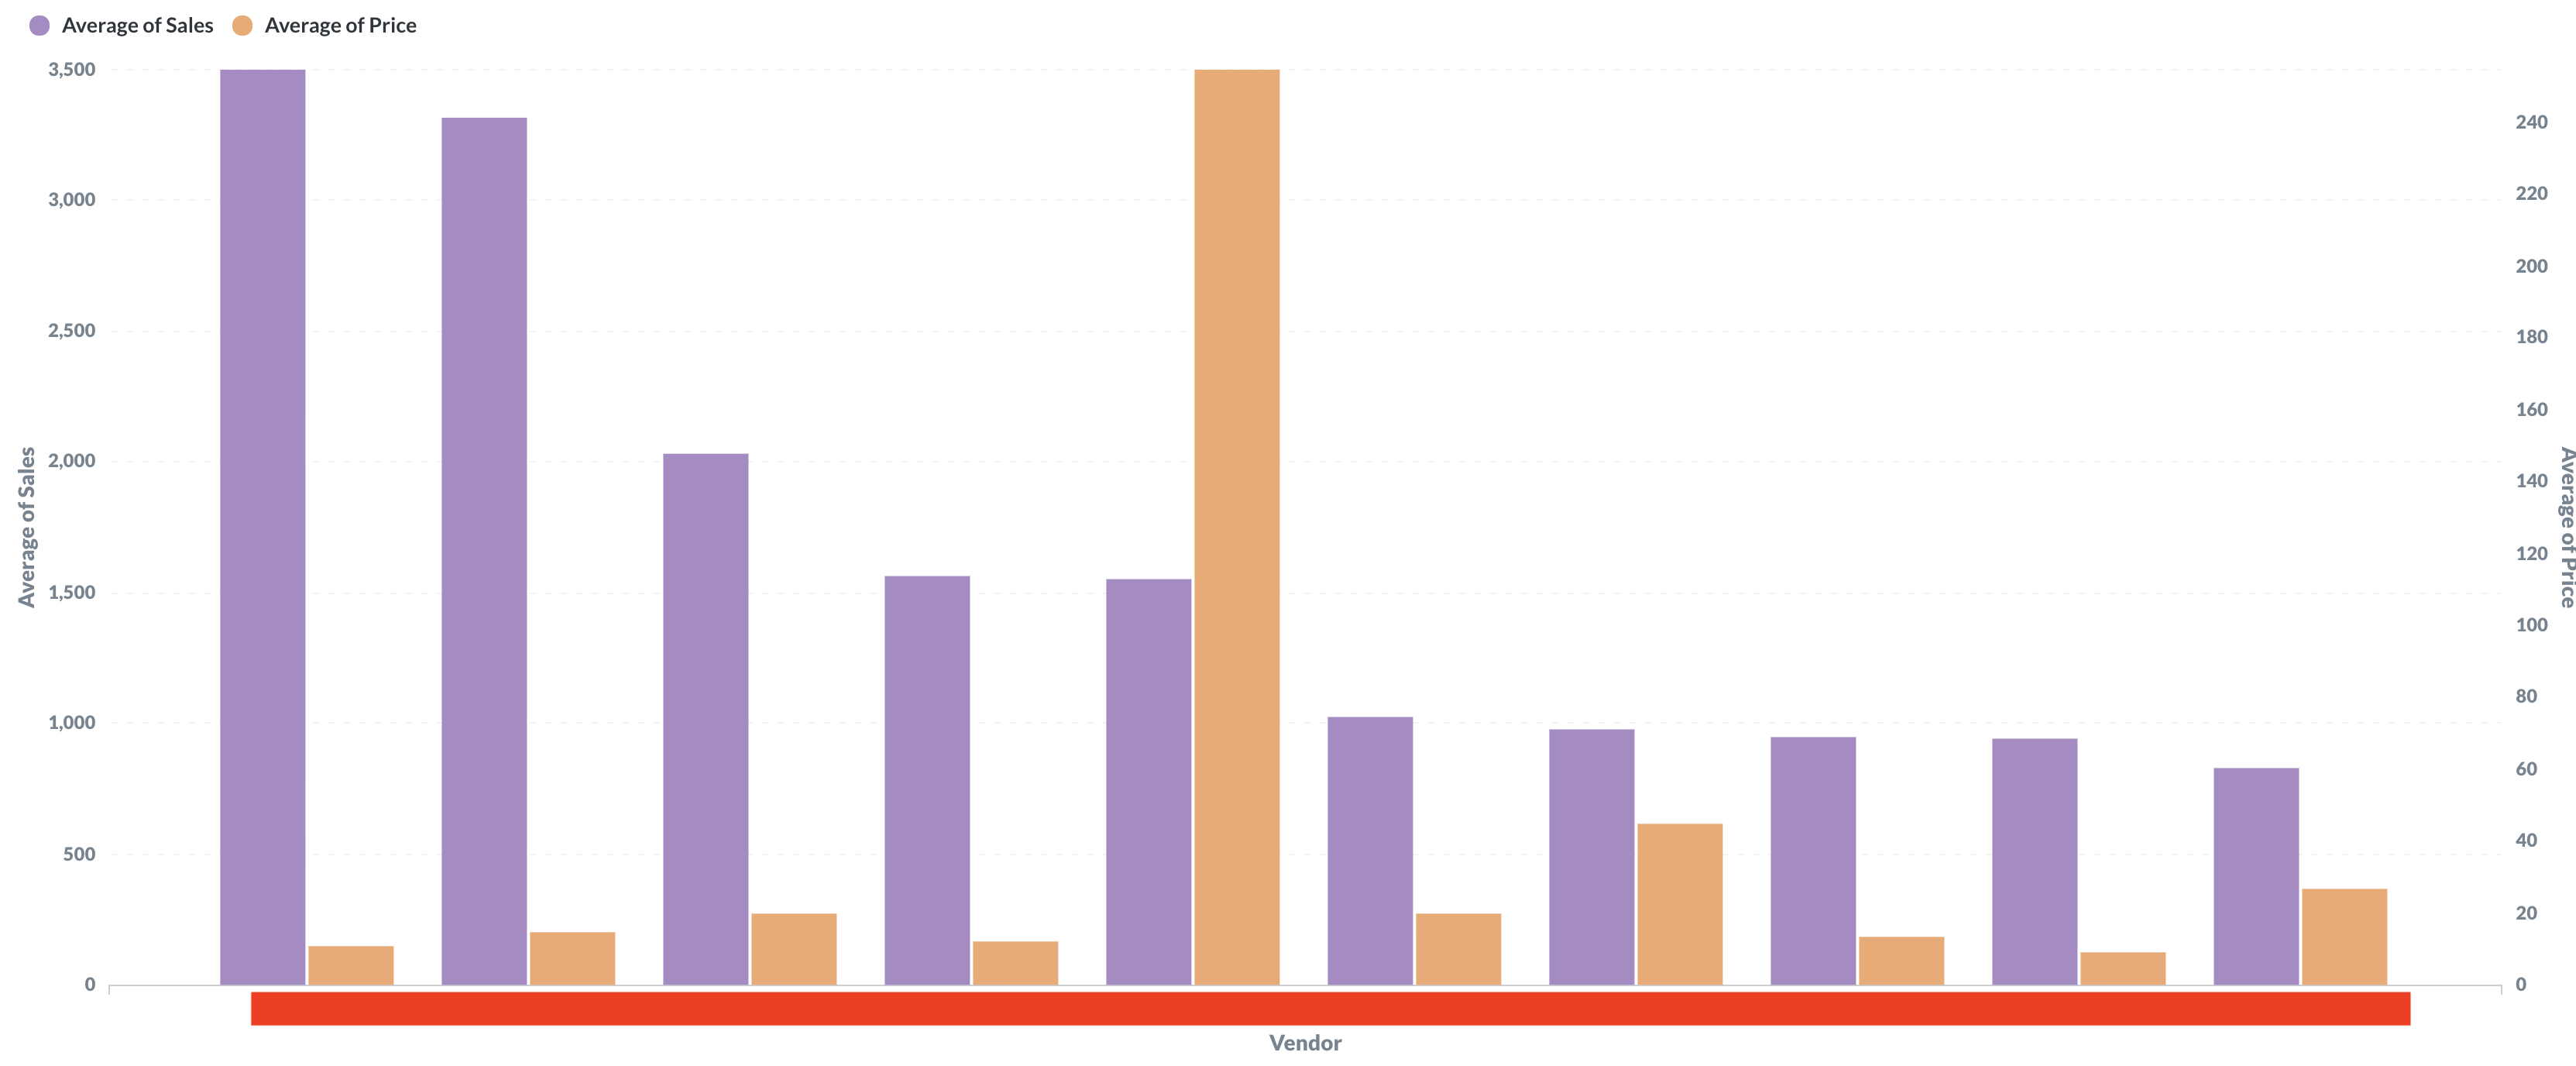
Less is more.
Yes, it’s correct if you are looking at this graph.
For example, a top vendor who has average of 3500 sales by product that is around $20 will give him: 3500 x $20 = $70,000.
A nice payday you will say, but keep in mind that for each sale, the package can be lost or seized.
If we look at the vendor who sells his product around $250 but has around 1500 sales, it will net him 1500 x $250 = $375,000.
1500 is less than 3500, which means, there are less chance that his package get lost or seized.
While, this is pure logical, it does not represents a real word experience (eg. products can be seized at any time)
And that’s it. A quick overview of Empire market. While there is a lot of data we can analyse, this is just a beginning. Let me know your thoughts and inputs.